Key features to effectively monitor and analyze requests. With advanced filtering, search, prioritization and reporting tools, companies can quickly identify and resolve key issues, as well as track progress and measure the effectiveness of deployed solutions.
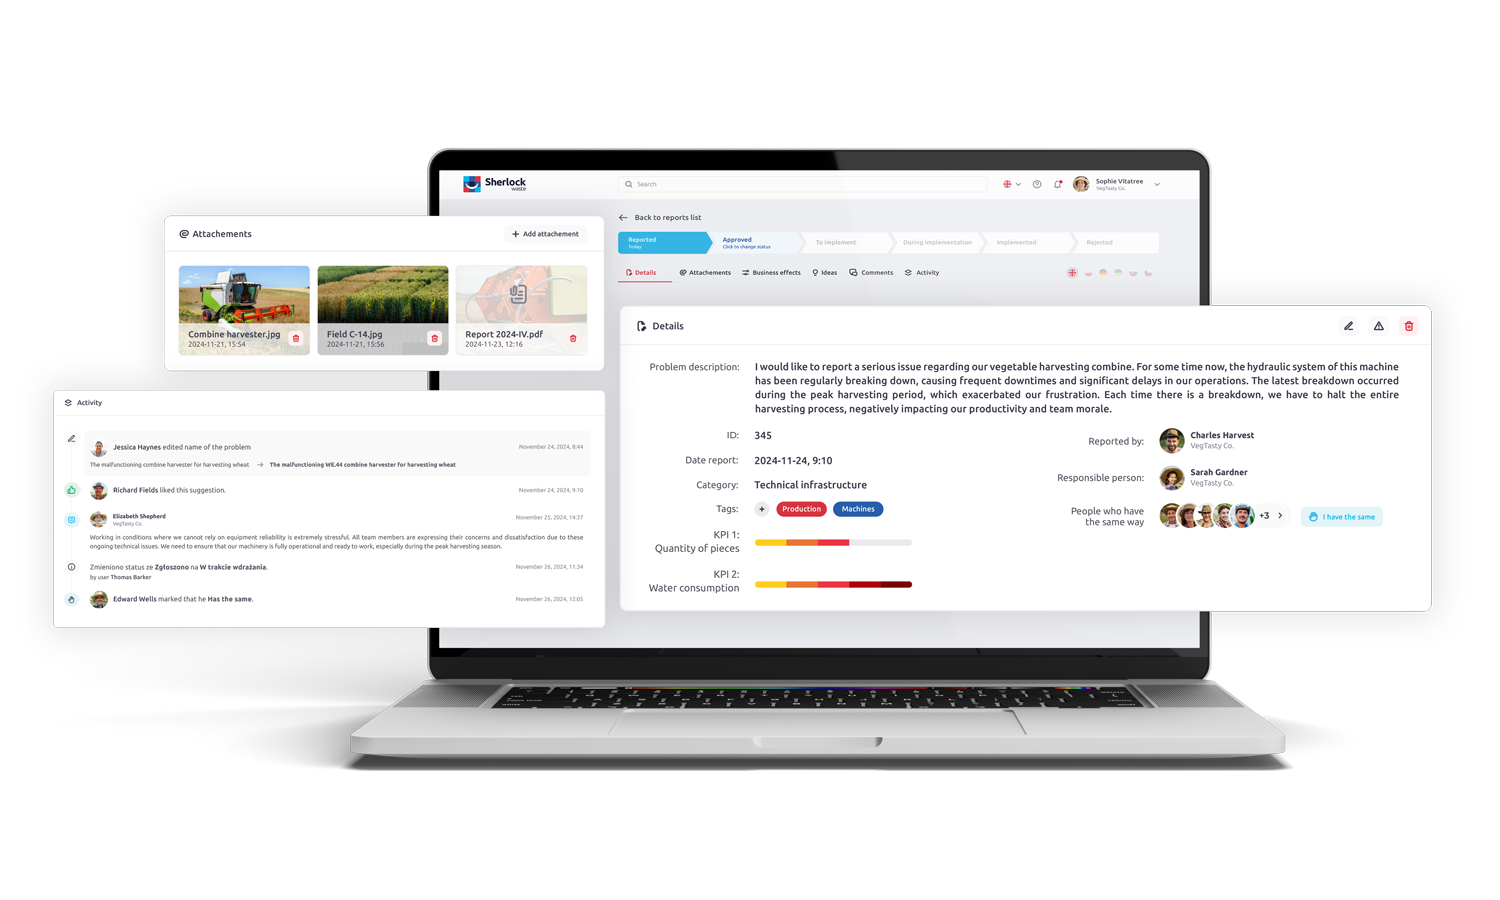
Sherlock provides a complete view of all information related to requests. In the manager's dashboard, you can view a detailed description of the problem, location, date of the request, attached photos documenting the problem, as well as ideas for resolving the problem. The feature also provides access to the ticket's history, including all actions taken and the current status. This allows users to track the progress of the reported problem and evaluate the effectiveness of the actions taken. The functionality provides insight into the results of the actions taken, allowing users to assess their effectiveness and sustainability.
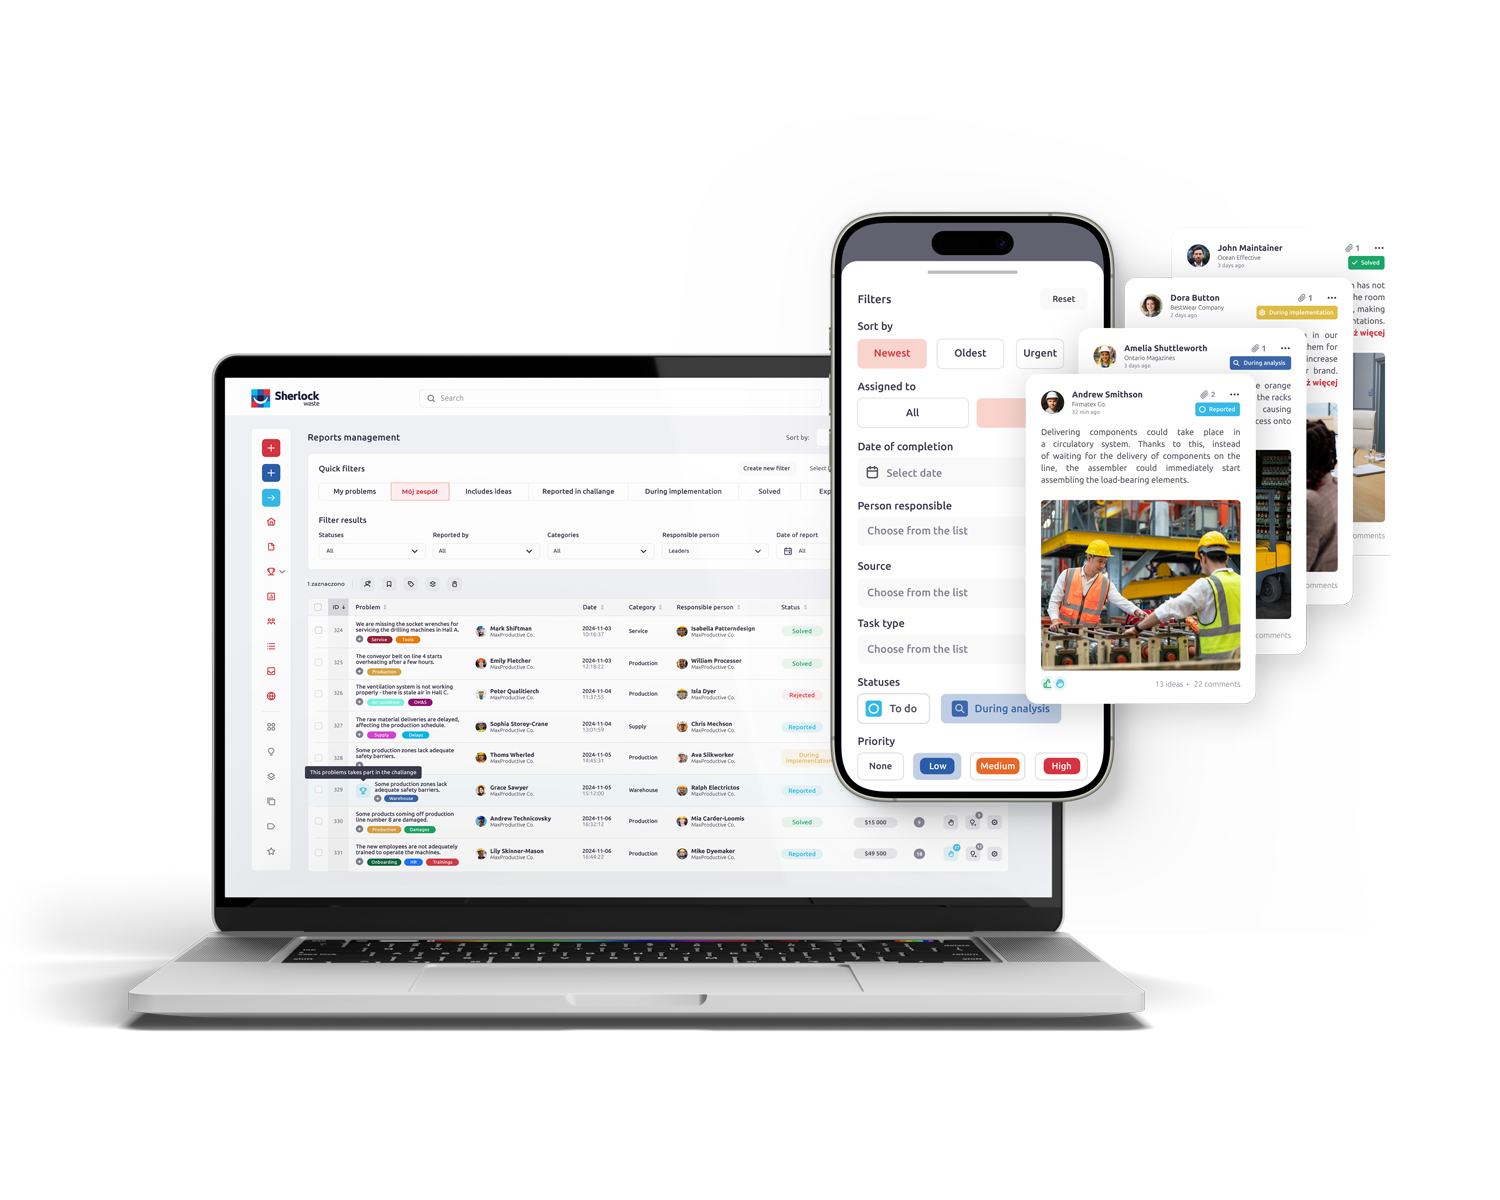
The dashboard makes it easy to manage submissions in the system, offering filtering by status, category, tag, date added, responsible party and submitter. You can also search for submissions using keywords. This functionality allows you to view and manage submissions quickly and efficiently.
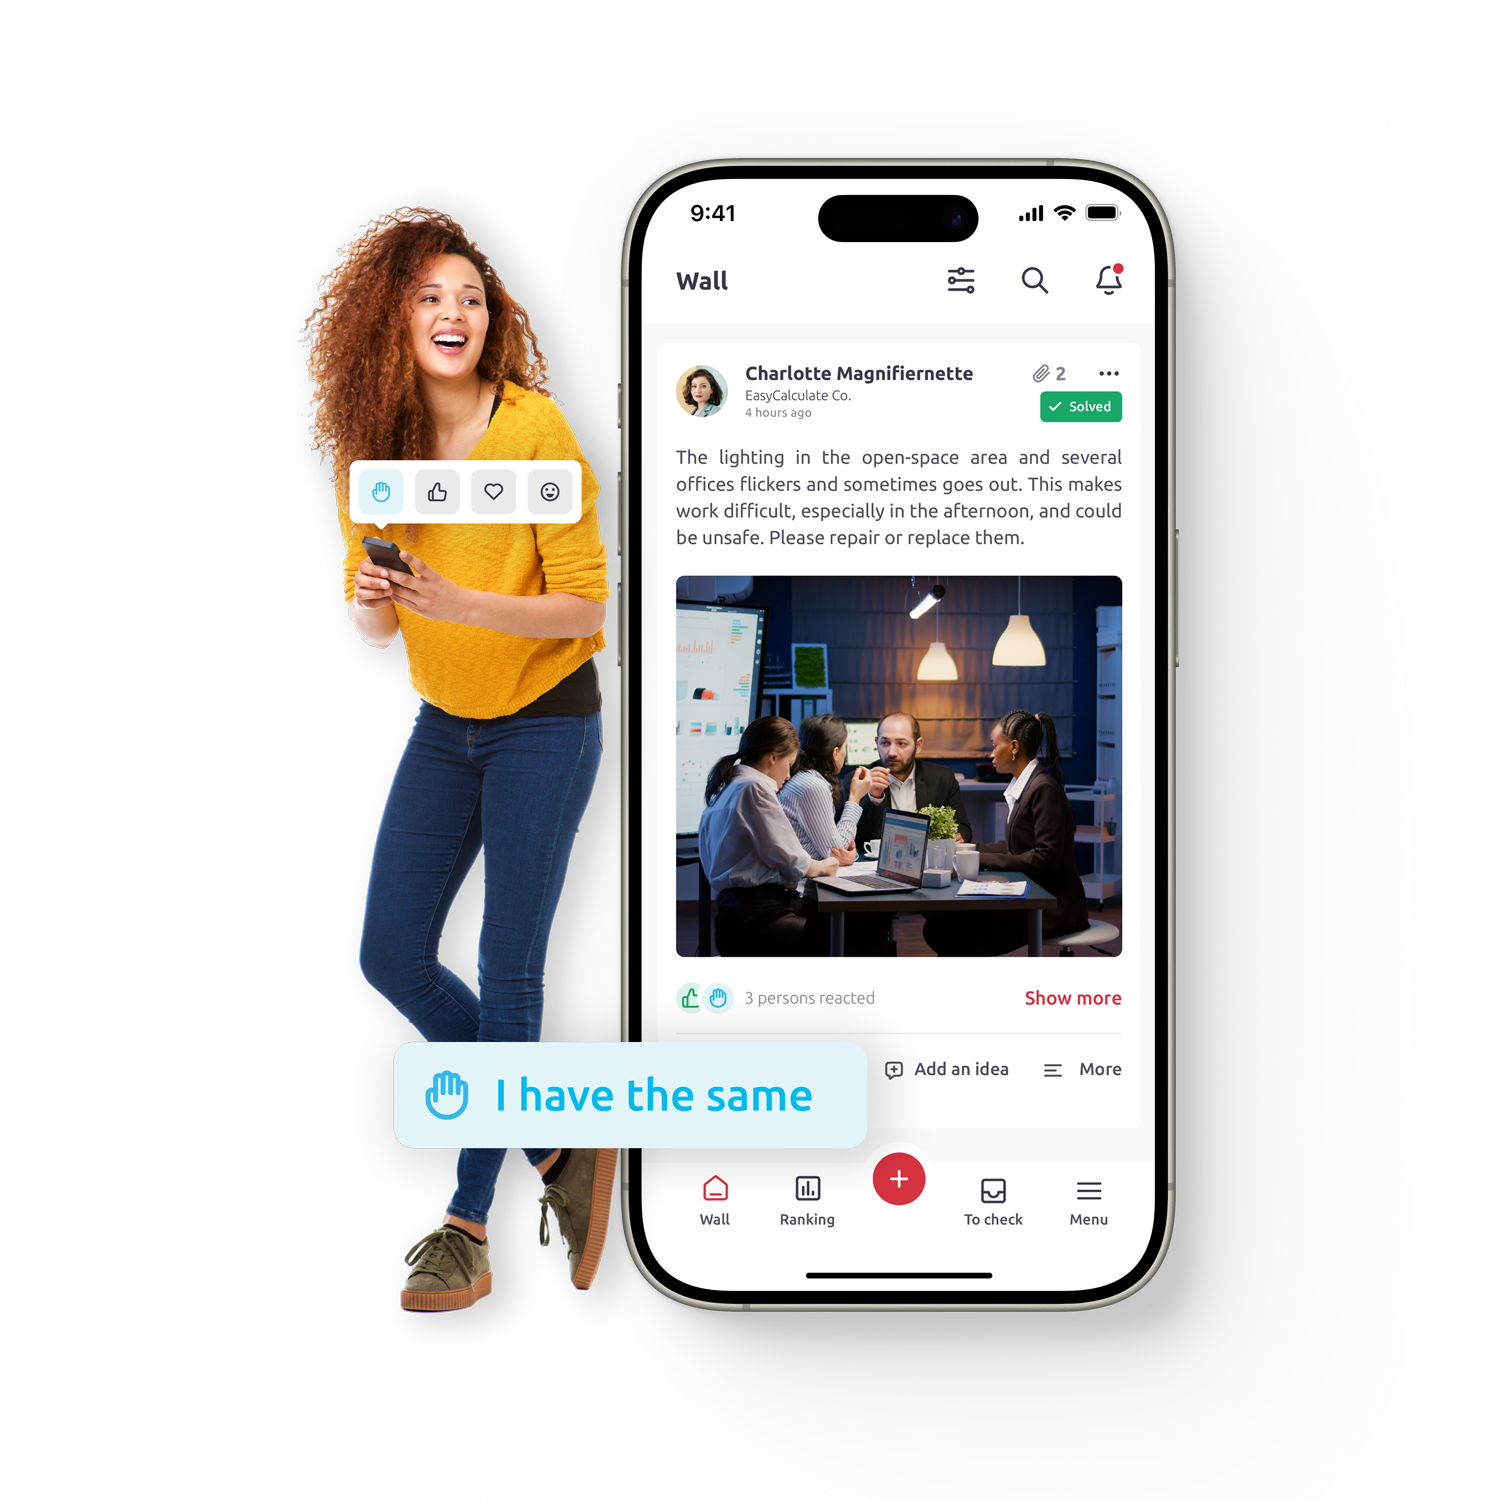
Funkcja „Mam to samo” pozwala pracownikom zaznaczyć, że dany problem dotyczy również ich dotyczy i jest dla nich istotny. Dzięki tej opcji, zgłoszenia mogą zbierać wiele potwierdzeń od różnych użytkowników, co zwiększa ich priorytet w systemie. Funkcja ta pomaga w identyfikacji najważniejszych kwestii wymagających natychmiastowej uwagi.
The business effects calculator allows users to estimate the financial benefits of implementing employee suggestions and solving problems. Users can enter data on resources saved, such as time, materials or energy, and the calculator automatically converts them into financial values. With this tool, companies can easily see what savings have resulted from the actions taken, which motivates further implementation of improvements. It also enables the generation of reports that show the long-term benefits of waste reduction - this supports strategic decision-making. Thanks to its transparency and ease of use, the calculator is becoming a key tool in resource management and business process optimization.

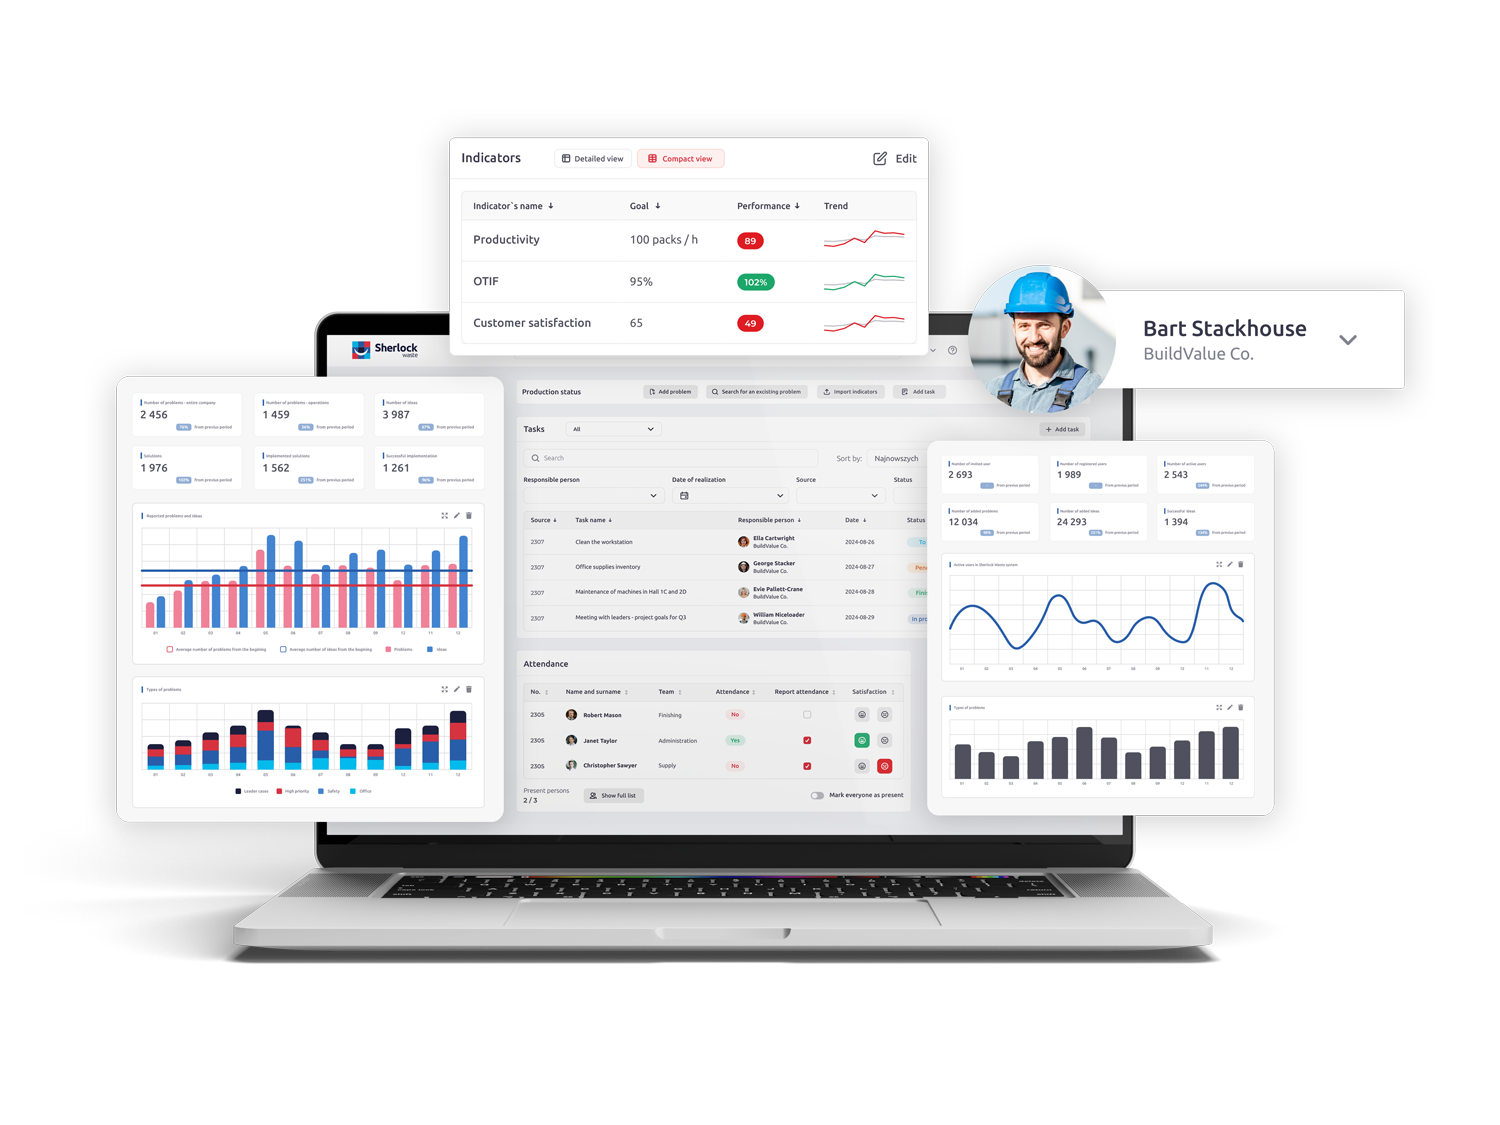
Dashboards with widgets are a tool for monitoring individual, team or whole organization activity. Widgets present specific statistical data in the form of numbers, charts or tables, making it easy to track key indicators and trends.


„Sherlock waste spółka z ograniczoną odpowiedzialnością” realizuje projekt: „Ekspansja produktów firmy Sherlock Waste na rynki zagraniczne.” na podstawie umowy POIR.03.03.03-02-0138/20-00 w programie Operacyjny Inteligentny Rozwój 2014-2020, 3.3.3. Wsparcie MŚP w Promocji Marek Produktowych – GoToBrand. Celem projektu jest dotarcie z produktami firmy na nowe rynki zagraniczne, w szczególności USA, UK, DAH oraz Bliski Wschód. Całość projektu o wartości: 332 520 zł netto Łączne dofinansowanie ze środków UE: 282 642 zł netto.
„Sherlock waste spółka z ograniczoną odpowiedzialnością realizuje projekt pn.„Sherlock Waste” na podstawie Umowy o Wsparcie zawartej w dniu 9 stycznia 2019 roku z Tech-Impact Fund Sp. z o.o. z siedzibą w Krakowie, Tech-Impact Fund Spółka z ograniczoną odpowiedzialnością ASI sp. k. z siedzibą w Krakowie oraz Narodowym Centrum Badań i Rozwoju z siedzibą w Warszawie, współfinansowany ze środków Unii Europejskiej w ramach Programu Operacyjnego Inteligentny Rozwój 2014-2020, Działanie 1.3: Prace B+R finansowane z udziałem funduszy kapitałowych, Poddziałanie 1.3.1: Wsparcie Projektów badawczo-rozwojowych w fazie preseed przez fundusze typu proof of concept – Bridge Alfa.
The purpose of the Project is to carry out research and development work, which will result in the development of a tool - a mobile application permanently increasing the involvement of employees in the improvement of the company (so-called Continous Improvement). The tool will serve to:
How to effectively engage employees in improvement?
FREE WEBINAR 06 February 2024 | 10:00-11:30 am
FREE WEBINAR
06 February 2024 | 10:00-11:30 am